Michael Jarvis: Share the Love, Share the Data, Follow the Money
The following blog by Michael Jarvis was originally posted on the Open Government Partnership blog on the occasion of the global conference of the Extractive Industries Transparency Initiative (EITI) in Lima, Peru. It’s an update of our ongoing work creating a visual that can illustrate multiple flows of money between governments and companies and between national and local levels of government.
Over a thousand people who care about transparency in oil, gas and mining are gathered in Lima this week for the Extractive Industries Transparency Initiative Global Conference. Many of us are also involved with the Open Government Partnership.
This has me asking: are we doing enough to share between transparency initiatives?
We can share more of the learnings on how to manage a multi-stakeholder governance process more effectively – there is a session at Lima on this, though a shame that the experience of the OGP Support Unit will not be represented. There appears to be much to learn from the successes and challenges of each governance process.
We should certainly be doing more to share the data countries generate and publish under these various platforms. I’m looking forward to the data storytelling bootcamp in Lima, but some of the projects being featured are quite boutique in application. Can we think bigger? Can we use the disclosures under the commitments of EITI, OGP, Open Contracting, Construction Sector Transparency Initiative and more to really enable citizens to know how their resources translate into tangible benefits?
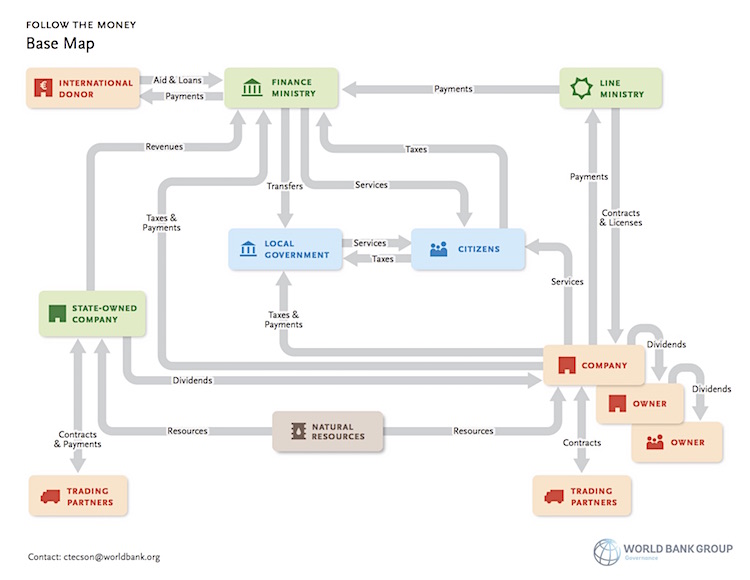
It comes back to the ability to follow the money. At the recent OGP Summit in Mexico City, I introduced a visualization of how to follow the money from natural resources in the ground through to services to citizens. The flowchart acts as a visual cue that tracks the relationships, revenues, and expenditures that flow through the extractives sector.
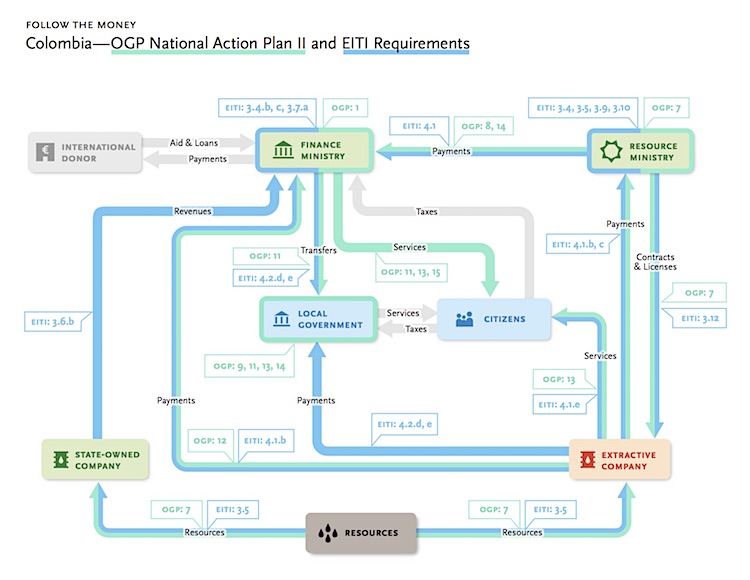
If you map the data that countries need to report under the EITI standard, you already cover many of the flows. If you then consider data generated by OGP commitments in certain countries tracked through the excellent Independent Reporting Mechanism portal, you cover more still. Take the case of Colombia. When you map EITI and OGP data points together, we can go a long way in determining the fiscal picture. By structuring data points against this framework, the concept of following the money is no longer abstract.
We need a more conscious effort to dig into the data that is becoming available, and combine data sets to make sense of all the information we have. Why not have data flow automatically to populate more intuitive framings, like this visual? If we do so, we can more accurately determine where the gaps are and which flows remain opaque. Then we can do more to make citizens aware of what existing disclosures can—and cannot—tell them. For their part, policy makers can more easily reflect on the insights the data can provide. That, in turn, will validate the importance of the initiatives that encouraged the disclosure in the first place.